- This wiki is out of date, use the continuation of this wiki instead
Fenix profiler
From FenixWiki
(Difference between revisions)
| Revision as of 20:04, 5 April 2008 (edit) Sandman (Talk | contribs) (New page: Category:general Category:debugging The Fenix profiler is a handy debugging tool. It shows how much power is needed for certain systems of Fenix, most particularly the drawing and...) ← Previous diff |
Revision as of 20:06, 5 April 2008 (edit) (undo) Sandman (Talk | contribs) m Next diff → |
||
| Line 38: | Line 38: | ||
| End | End | ||
| </pre> | </pre> | ||
| + | Used in example: [[restore_type]], [[process]], [[frame]] | ||
| + | |||
| {{Image | {{Image | ||
| - | | image = Profiler. | + | | image = Profiler.png |
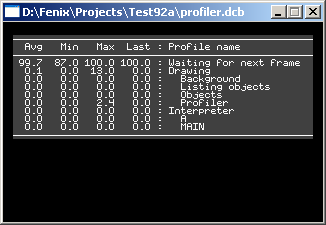
| | caption = A typical profiler window of a program doing nothing | | caption = A typical profiler window of a program doing nothing | ||
| }} | }} | ||
| - | |||
| {{Debugging}} | {{Debugging}} | ||
Revision as of 20:06, 5 April 2008
The Fenix profiler is a handy debugging tool. It shows how much power is needed for certain systems of Fenix, most particularly the drawing and the interpreting.
To use the profiler, run in debug mode by compiling your program in FXC.exe with the argument "-g", and then show it in-program with ALT+P.
Shortcuts:
| ALT-P | - Show/hide the Fenix profiler |
| ALT-R | - Resets the profile history of the Fenix Profiler. |
| ALT-S | - Activate/Deactivate the Fenix Profiler. |
Example
Process Main()
Begin

    // To make sure the profiler is updated every frame
    restore_type = COMPLETE_RESTORE;

    A();

    Loop
        frame;
    End

End

Process A()
Begin
    Loop
        frame;
    End
End
Used in example: restore_type, process, frame

|
| Debugging | |
| Debugging • Fenix console • Fenix profiler | |
